AWS S3 offers 99.999999999% (11 9s) of data durability and 99.99% availability.
I wonder how the measurement for my home internet would be.
In this post, I’ll explain how the measurement was performed in detail, the configurations I used, as well as the Grafana dashboard I created.
TL;DR
Here’s the “internet connectivity level” in the sense of the number of 9s, measured for the past 90 days (2022-05-27 to 2022-08-25), by periodically probing a series of well-known servers on the internet from my home lab, with both HTTPS and DNS requests.
The metrics are presented in the number of 9s. In other words, a measure of 3 means 99.9% of the probing requests were successful. Likewise, 4 means 99.99% of requests went through.
| Target | Connectivity (in number of 9s) | Probing Method |
| https://1.1.1.1 | 3.7 | HTTP |
| https://connectivitycheck.gstatic.com | 3.7 | HTTP |
| https://www.gstatic.com | 3.7 | HTTP |
| http://www.msftconnecttest.com | 3.6 | HTTP |
| https://cp.cloudflare.com | 3.5 | HTTP |
| 1.0.0.1 | 3.1 | DNS |
| 1.1.1.1 | 3.1 | DNS |
| 8.8.8.8 | 3.1 | DNS |
| 8.8.4.4 | 3.1 | DNS |
| https://captive.apple.com | 2.9 | HTTP |
| https://www.apple.com | 2.6 | HTTP |
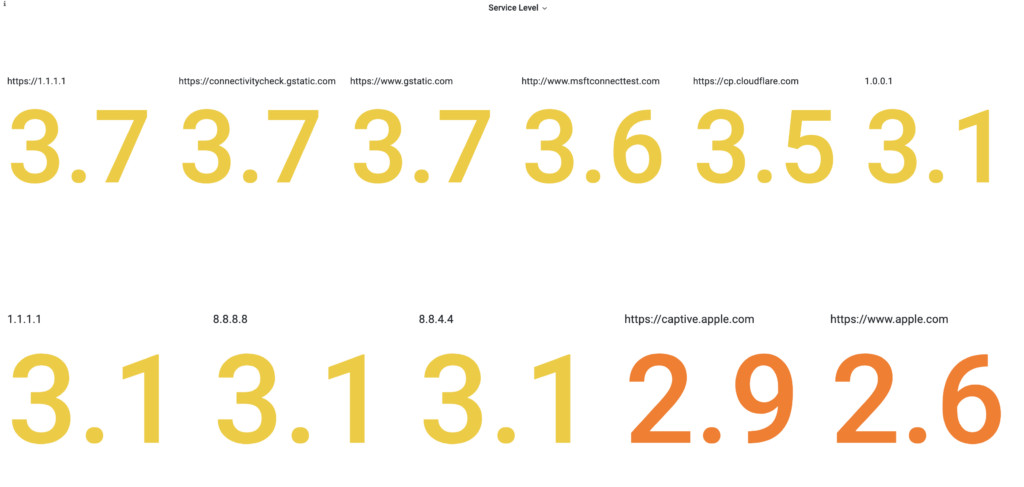
Higher than 99.9% (3.7 9s, more on the decimal part later) of uptime is quite good for home internet. HTTP requests are generally more reliable than DNS requests, which correlates to the reliable nature of TCP over UDP.
The Setup
This monitoring is done by using the prometheus/blackbox_exporter and Prometheus, visualization is done via Grafana. Everything is running inside of Docker.
Here’s the docker-compose services to start all the related processes. Remember to update the config to fit your setup.
# docker-compose.yaml
version: "2.4"
services:
  prometheus:
    image: prom/prometheus
    volumes:
      - ./prometheus/prometheus.yml:/etc/prometheus/prometheus.yml:ro
      - ./prometheus/rules:/rules:ro
      - prometheus_data:/prometheus
    command:
      - '--config.file=/etc/prometheus/prometheus.yml'
      - '--storage.tsdb.path=/prometheus'
      - '--storage.tsdb.retention.time=500d'
      - '--web.console.libraries=/usr/share/prometheus/console_libraries'
      - '--web.console.templates=/usr/share/prometheus/consoles'
      - '--web.external-url=[YOUR SERVER URL]'
      - '--web.enable-admin-api'
    networks:
      - monitoring
      - default
    restart: always

  blackbox-exporter:
    image: prom/blackbox-exporter
    volumes:
      - ./blackbox-exporter/conf.yaml:/conf.yaml
    networks:
      - monitoring
    restart: always
    command:
      - --config.file=/conf.yaml

  grafana:
    image: grafana/grafana
    volumes:
      - grafana_data:/var/lib/grafana
    environment:
      - GF_SERVER_PROTOCOL=http
      - GF_INSTALL_PLUGINS=natel-discrete-panel
      - GF_SECURITY_ADMIN_USER=[Your gmail or google workspace email]
      # OAuth with Google
      - GF_SERVER_DOMAIN=[Your Grafana Server Domain]
      - GF_SERVER_ROOT_URL=https://%(domain)s/
      - GF_AUTH_ANONYMOUS_ENABLED=false
      - GF_AUTH_DISABLE_LOGIN_FORM=true
      - GF_AUTH_BASIC_ENABLED=false
      - GF_AUTH_GOOGLE_ENABLED=true
      - GF_AUTH_GOOGLE_SCOPES=https://www.googleapis.com/auth/userinfo.profile https://www.googleapis.com/auth/userinfo.email
      - GF_AUTH_GOOGLE_CLIENT_ID=[Client ID]
      - GF_AUTH_GOOGLE_CLIENT_SECRET=[Client Secret]
      - GF_AUTH_GOOGLE_AUTH_URL=https://accounts.google.com/o/oauth2/auth
      - GF_AUTH_GOOGLE_TOKEN_URL=https://accounts.google.com/o/oauth2/token
      - GF_AUTH_GOOGLE_ALLOWED_DOMAINS=[email domain]
      - GF_AUTH_GOOGLE_ALLOW_SIGN_UP=true
    restart: always

networks:
  monitoring: {}

volumes:
  grafana_data: {}
  prometheus_data: { }
The individual config files as mounted in the docker-compose config:
# ./prometheus/prometheus.yml
global:
  scrape_interval: 10s
  evaluation_interval: 15s

scrape_configs:
  - job_name: internet-connectivity
    scrape_interval: 5s
    metrics_path: /probe
    params:
      module:
        - internet-connectivity
    static_configs:
      - targets:
        - https://www.gstatic.com/generate_204
        - https://connectivitycheck.gstatic.com/generate_204
        - https://captive.apple.com/hotspot-detect.html
        - https://www.apple.com/library/test/success.html
        - https://cp.cloudflare.com/
        - http://www.msftconnecttest.com/connecttest.txt
        - https://1.1.1.1/cdn-cgi/trace
    relabel_configs:
      - source_labels: [__address__]
        target_label: __param_target
      - source_labels: [__param_target]
        target_label: instance
      - target_label: __address__
        replacement: blackbox-exporter:9115

  - job_name: dns-upstream-health
    scrape_interval: 5s
    metrics_path: /probe
    params:
      module:
        - dns-upstream-health
    static_configs:
      - targets:
        - 8.8.8.8
        - 8.8.4.4
        - 1.1.1.1
        - 1.0.0.1
    relabel_configs:
      - source_labels: [__address__]
        target_label: __param_target
      - source_labels: [__param_target]
        target_label: instance
      - target_label: __address__
        replacement: blackbox-exporter:9115
# ./blackbox-exporter/conf.yaml
modules:
  internet-connectivity:
    prober: http
    timeout: 3s
    http:
      preferred_ip_protocol: ip4
      ip_protocol_fallback: false
  dns-upstream-health:
    prober: dns
    timeout: 2s
    dns:
      query_name: google.com
      query_type: A
      preferred_ip_protocol: ip4
      ip_protocol_fallback: false
In Grafana, use the following Prometheus query to construct and calculate the “number of 9s”:
sort_desc(log10(count_over_time(probe_success[$__range])) - log10(count_over_time(probe_success[$__range]) - sum_over_time(probe_success[$__range])))
Alternatively, refer to the following panel config blocks to replicate the exact same visualizations as mine. Note natel-discrete-panel plugin is used for one of the visualizations.
For the “number of 9s” view:
{
  "id": 553,
  "gridPos": {
    "h": 6,
    "w": 4,
    "x": 20,
    "y": 0
  },
  "type": "stat",
  "title": "Service Level",
  "transformations": [
    {
      "id": "renameByRegex",
      "options": {
        "regex": "(https?://[^/]*)/?.*",
        "renamePattern": "$1"
      }
    }
  ],
  "pluginVersion": "9.1.0",
  "description": "by counting of 9s, i.e. 99.9994% availability has a service level of 5. ",
  "fieldConfig": {
    "defaults": {
      "mappings": [],
      "thresholds": {
        "mode": "absolute",
        "steps": [
          {
            "color": "red",
            "value": null
          },
          {
            "color": "orange",
            "value": 2
          },
          {
            "color": "yellow",
            "value": 3
          },
          {
            "color": "green",
            "value": 4
          }
        ]
      },
      "color": {
        "mode": "thresholds"
      },
      "decimals": 1
    },
    "overrides": []
  },
  "options": {
    "reduceOptions": {
      "values": false,
      "calcs": [
        "lastNotNull"
      ],
      "fields": ""
    },
    "orientation": "auto",
    "textMode": "auto",
    "colorMode": "value",
    "graphMode": "none",
    "justifyMode": "auto"
  },
  "targets": [
    {
      "datasource": {
        "type": "prometheus",
        "uid": "000000002"
      },
      "exemplar": false,
      "expr": "sort_desc(log10(count_over_time(probe_success[$__range])) - log10(count_over_time(probe_success[$__range]) - sum_over_time(probe_success[$__range])))",
      "hide": false,
      "instant": true,
      "interval": "",
      "legendFormat": "{{ instance }}",
      "refId": "A"
    }
  ],
  "datasource": {
    "type": "prometheus",
    "uid": "000000002"
  }
}
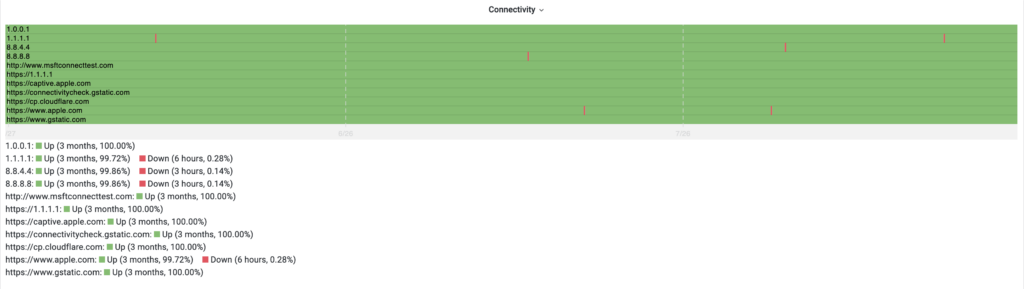
For the timeline breakdown:
{
  "id": 551,
  "gridPos": {
    "h": 6,
    "w": 12,
    "x": 8,
    "y": 0
  },
  "type": "natel-discrete-panel",
  "title": "Connectivity",
  "transformations": [
    {
      "id": "renameByRegex",
      "options": {
        "regex": "(https?://[^/]*)/?.*",
        "renamePattern": "$1"
      }
    }
  ],
  "backgroundColor": "rgba(128,128,128,0.1)",
  "colorMaps": [
    {
      "$$hashKey": "object:288",
      "color": "#CCC",
      "text": "N/A"
    },
    {
      "$$hashKey": "object:291",
      "color": "#73BF69",
      "text": "Up"
    },
    {
      "$$hashKey": "object:294",
      "color": "#F2495C",
      "text": "Down"
    }
  ],
  "crosshairColor": "#8F070C",
  "description": "",
  "display": "timeline",
  "expandFromQueryS": 0,
  "extendLastValue": true,
  "highlightOnMouseover": false,
  "legendPercentDecimals": 2,
  "legendSortBy": "-ms",
  "lineColor": "rgba(0,0,0,0.1)",
  "metricNameColor": "#000000",
  "rangeMaps": [
    {
      "$$hashKey": "object:304",
      "from": "null",
      "text": "N/A",
      "to": "null"
    }
  ],
  "rowHeight": 15,
  "showDistinctCount": false,
  "showLegend": true,
  "showLegendCounts": false,
  "showLegendNames": true,
  "showLegendPercent": true,
  "showLegendTime": true,
  "showLegendValues": true,
  "showTimeAxis": true,
  "showTransitionCount": false,
  "targets": [
    {
      "datasource": {
        "type": "prometheus",
        "uid": "000000002"
      },
      "exemplar": true,
      "expr": "probe_success",
      "format": "time_series",
      "instant": false,
      "interval": "",
      "legendFormat": "{{ instance }}",
      "refId": "A"
    }
  ],
  "textSize": 12,
  "textSizeTime": 12,
  "timeOptions": [
    {
      "name": "Years",
      "value": "years"
    },
    {
      "name": "Months",
      "value": "months"
    },
    {
      "name": "Weeks",
      "value": "weeks"
    },
    {
      "name": "Days",
      "value": "days"
    },
    {
      "name": "Hours",
      "value": "hours"
    },
    {
      "name": "Minutes",
      "value": "minutes"
    },
    {
      "name": "Seconds",
      "value": "seconds"
    },
    {
      "name": "Milliseconds",
      "value": "milliseconds"
    }
  ],
  "timePrecision": {
    "name": "Minutes",
    "value": "minutes"
  },
  "timeTextColor": "#d8d9da",
  "units": "short",
  "use12HourClock": true,
  "useTimePrecision": false,
  "valueMaps": [
    {
      "$$hashKey": "object:302",
      "op": "=",
      "text": "N/A",
      "value": "null"
    },
    {
      "$$hashKey": "object:306",
      "op": "=",
      "text": "Up",
      "value": "1"
    },
    {
      "$$hashKey": "object:308",
      "op": "=",
      "text": "Down",
      "value": "0"
    }
  ],
  "valueTextColor": "#000000",
  "writeAllValues": false,
  "writeLastValue": false,
  "writeMetricNames": true,
  "datasource": {
    "type": "prometheus",
    "uid": "000000002"
  }
}